 |
Zen 3's announcement has come and gone with a small hint at what's in store on the 28th of October regarding the next generation of graphics processing units from AMD. However, I wanted to go over what we may expect regarding that "next gen" RNDA 2 performance and how it might relate to the next gen consoles at the same time...
Last time, I went over what I extrapolated from past performance to be the potential performance figures for Navi 2 but that post was incredibly messy due to the obfuscation and misdirection that Nvidia used in their presentation. It was actually quite refreshing to watch AMD's short and simple presentation after that.
We saw that the performance of the RTX 3080 at 4K, non-ray tracing settings varied between 160-180 % compared to the RTX 2080 in the previews and that was confirmed in actual post-release reviews, as well. I had compared the relative score of the RX 5700 XT to the RTX 2080 via Userbenchmark in order to estimate potential percentage improvements to the theoretical doubling of the resources on the die to achieve an 80 compute unit part. At the time, the performance difference was 26% but since Userbenchmark is liable to alter the score based on adjustments to their scoring system and also user submissions (hence the name!) the delta now stands at 30%. If I compare that to equivalent benchmarks from the same outlet (AC:Odyssey) I find around a 28% delta - so effectively the same.
 |
| The teaser for RDNA 2 performance... |
Now, as I mentioned above, AMD teased their next gen GPU performance in the above three games. From this we can infer the performance of their GPU relative to an RTX 3080. HOWEVER, there has been speculation that this performance is not attributed to the top-most card in their product stack. So let's see if this could possibly be the case.
Going back to my "standard" reviewing source (to remove as many variables as possible), let's look at the performance of the RTX 3080 over the RTX 2080 in both Gears 5 and Borderlands 3. Unfortunately, CoD:MW is not used by Digital Foundry in their benchmarking but we can work on that a bit later...
 |
 |
| Credit: Digital Foundry/Eurogamer for both graphs (truncated slightly for readability here) |
We can see here that this RDNA 2 card performs equivalently to the RTX 3080 in Borderlands 3 (61 fps for both cards) and slightly slower in Gears 5 (73 fps to 81 fps). I have to make a comparison with another reviewing source (Guru3D) in order to ascertain the performance in Modern Warfare by comparing a common fourth data point. I found that the performance in Metro Exodus is essentially the same across the two reviewing sites, meaning that I could do an approximate comparison with Guru3D's MW data points at 4K. With this in mind, I can see that, again, the RTX 3080 beats the RDNA 2 card with 103 fps to 88 fps.
There is one further adjustment here and that is the performance delta between the CPUs utilised in these benchmarks. Helpfully, Guru3D used an Intel i9-10900K in their benchmarking, giving us an approximate comparison to the charts shown at the top of this post. We can see that the Intel CPU was scoring 104 fps at 4K when paired with the 3080 in battlefield V and that the R9 5900X had a delta of -3% in frames per second for that game at those settings. Far Cry 5 should perform very close to its descendant, New Dawn and that gave 97 fps on the Intel CPU, whereas the 5900X had a performance increase of 2%.
[UPDATE] I messed up the Modern Warface performance comparison and thus really lowered all the calculated performance numbers. I've corrected this below with each correction in green bold and the old number struck for clarity. However, it doesn't change the conclusions at the end of this post, it just brings the actual numbers closer to reality.
So, for argument's sake, I'm going to assume that the AMD CPU for the three benchmarks AMD provided is roughly equivalent to the Intel i9-10900K results. So, going from the results in the Digital Foundry review, the RTX 3080 has 181% the performance of the 2080 in Borderlands 3 and 165% the performance in Gears of War 5. This also puts the performance of the RDNA 2 card at 181% and 148% respectively for those two titles. While Guru3D didn't compare against the stock RTX 2080, they did compare against the RX 5700 XT RTX 2080 Super*, allowing us to account for an 30 8% performance difference and estimate a result of 84 61 fps for an RTX 2080 in Modern Warfare, giving a 123 169% increase to the RTX 3080 and 105 144% increase to the RDNA 2 card.
*This was a rather silly mistake to make. Modern Warfare does not display anywhere near the average performance disparity between the RTX 2080 and RX 5700 XT, meaning that 30% was grossly over-estimating the performance of the 2080 - if the SUPER is only achieving 67 fps @ 4k, how can the base card be achieving 84 fps?! So, I changed this to a comparison between the base card and super for estimated performance difference.
This gives an average performance increase of 56 72% for the RTX 3080 and 45 58% for the RDNA 2 card, giving an averaged performance delta between the two of around 20-25%. Obviously, this doesn't apply to all titles or game engines and this paints a low-ball estimate of both cards but we can use this figure to see how we can compare to last gen.
Returning to that calculation I performed last time, let's update that with realistic gaming clock frequencies that the RDNA 2 cards might be able to achieve*.
*Although the cards have been seen at 2500 MHz, this is unlikely to be a sustained "game clock" (as defined by AMD). It might be achieveable as a boost clock but that's not really helping us much in a sustained load on the GPU.
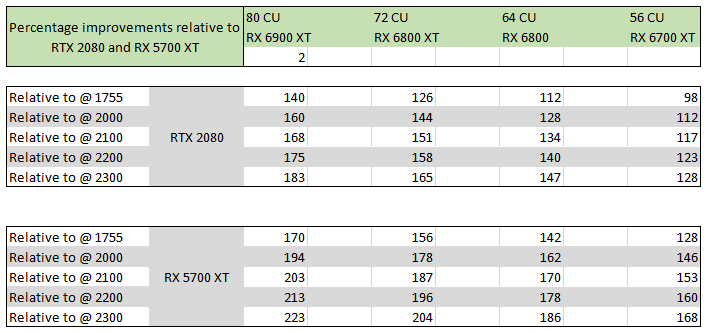 |
| Here we can see that both a theoretical 80 CU & 72 RDNA 2 card could match the rumoured performance leaked to Mooreslawisdead. |
Looking at these performance estimates, I can see three performance tiers that would match this level of performance :- 80 CU @ 1800 1975 MHz, 72 CU @ 2000 2200 MHz and 64 CU @ 2250 2475 MHz. The 56 CU estimation would have to have a sustained clock speed of above 2.3 2.8 GHz... which I guess is possible, but unlikely.
However, if we add a 7% processing bonus due to improvements and optimisations (rumoured improvements are on the order of 7-15%), we start to see that 72 CU achieve this @1900 2050 MHz, 64 CU @2.15 2.32 GHz and the 56 CU could see it at the unlikely frequency of 2.45 2.65 GHz (given the rumours of 2.5 GHz cards seen during development).
 |
| I labelled these as different SKUs as an indication of relative performance options - not based on some insider knowledge... |
So, what does this suggest? It suggests that the RDNA 2 card shown at the AMD Ryzen 5000 presentation was potentially not the top card. It could, within reason, be attributable to a highly clocked 64 CU part combined with a performance increase but more likely, it is attributable to a more reasonably clocked 72 CU part with or without a performance increase.
This would allow for a theoretical 80 CU part (+7% IPC), running at 2.4 GHz game clock to match the RTX 3090. However, the big problem with all of this is that virtually any combination of rumoured clockspeed range and these numbers of compute units could result in a graphics card that matches 80% of the performance of the RTX 3080... so we're really quite blind as to which part we actually saw in the AMD reveal event.
My hopes align with others - that the card shown was not the highest end SKU and I think that the estimations I've made above show that this can very much be the case.
No comments:
Post a Comment