 |
With the recent release of the new updated beta version of Presentmon by Intel to include their new metric, GPU Busy, many people have become excited about the potential for it to have some sort of positive impact on the game review and user diagnostic testing landscapes.
However, if you follow me on Twitter, you may have noticed how I've not been impressed by the execution surrounding this metric - something which I think many people might have missed in the hubbub for something new and meaningful in system performance assessments.
Between Two Ferns...
At its core, the concept of introducing GPU Busy is to provide the user with an idea of the deviation between when a frame is presented and how much time the GPU is specifically working on that frame.
Let's put aside one thing first - I do not dislike the idea of GPU busy. Knowing how much time it takes an application to render a frame can be a very useful diagnostic tool which, for people unable to use or unwilling to learn the various profiling type tools, could provide some benefit.
However, the caveat here is that this pure number does not give any sort of logistical clarity on the reason for that specific length of time consumed. Is the difference due to API handling, driver issues, a particular application inefficiency, or some other bottleneck within the I/O system?
Seriously, which is it? GPU Busy doesn't know because GPU Busy is a 'dumb' metric - it is not informed by anything other than time and number of frames produced.
Thus, there is something intrinsically wrong with taking that blunt instrument and using it to infer the reasons for lengths of time in the render pipeline surrounding the actual GPU processing step. Worse, marketing it as some sort of diagnostic tool when it has very little diagnostic ability for the untrained and people who just want to run it on their newly-bought game to see how it performs, isn't great!
Other Concerns...
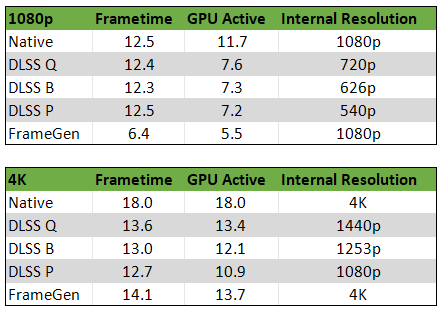
There are some other concerns regarding GPU Busy as a metric for users to manage. First off is that it is thwarted by upscaling techniques, Frame Generation, and frame limiters. Two of those techniques are pretty obvious, upscaling and frame limiters will reduce GPU load, meaning that the GPU Active time will decrease. However, there is a confounding factor here - framerate should proportionately increase when using upscalers (Isn't that the point of them?!) so, the difference between framepresents and GPU Active time should be reduced.... but, as you can see below, it isn't always the case!
 |
| Tests performed in Spider-man at very high quality settings and draw distances using an i5 12400 and RTX 4070... |
The more experienced among you will immediately know the reason - upscaling technologies have a processing overhead and Spider-man is quite CPU bound in its design. So, combining those facts, we can see that as the application becomes more CPU bottlenecked, the difference between GPU Active and the frametime presents increases - which is the expected behaviour. However, at the same internal resolution (1080p native vs 4K DLSS Performance) the GPU is less busy. That doesn't make sense to me - and it's less busy by a good margin! Surely, the DLSS overhead should push that closer to the actual frametime calls?
The question here then becomes... when is the application GPU-bound? At native 4K, it really is. But is it at DLSS Quality, Balanced, Performance? From the relative level of improvement in framerates, I would say it is essentially CPU-bound at DLSS Quality, due to the incrementally smaller improvements thereafter. But is that actually correct? The frametime does keep decreasing at each setting and the GPU becomes less and less utilised - there's an extra 7% performance (or ~5 fps) on the table between the Quality and Performance settings. So, maybe it isn't?
Further confusing matters, Nvidia's Frame Generation doesn't rely on presents from the programme/API to deliver frames - it delivers one frame and then works on the next frame but delivers an interpolated frame before delivering the second frame. This adds latency but the GPU is STILL working just as hard as it was before. But... somehow the GPU is no longer the bottleneck?
If you look at those numbers above, it seems likely that GPU Active is somehow dividing the "worktime" of the GPU by the number of frames issued into the display queue (or whatever you wish to call it) - i.e. at 1080p native, we get effectively 2 frames per CPU call. At 4K, it's a bit more of a challenge and so we only get a 30% improvement. The problem is that GPU Active shouldn't be working like this...
Of course, this is just guesswork - Unfortunately, in the same way that Frame Generation is a black box, so too is GPU Active to the average user (at least to me since I cannot understand the source code) and this can lead to misunderstanding and incorrect conclusions...
Next up, we have the logic of the metric.
Hardware Unboxed, via Techspot had a really good article going through the Presentmon beta application and GPU Busy metric... only, well... their explanation of when something is or is not CPU-bound was a little uncertain*: they confidently state that when the Frametime and GPU Busy metrics are equal then the GPU is the limiting factor at medium quality settings with FSR enabled. But with RT overdrive enabled**, the CPU is now the limiting factor... maybe. They appear to be not quite sure about that from the language they use. However, this conclusion comes when the difference between the frametime (17.8 ms) and GPU Busy (17.1 ms) is only a mere 0.7 ms difference!
*Most likely because without guidance, the user has to make up any and all rules regarding the interpretation of the metric!
**Please note that RT: Overdrive has Frame Generation enabled on the RTX 4070 Ti they were testing on... and bear in mind what we just discussed regarding how GPU Active potentially calculates itself.The problem here is that there is no guidance on what sort of difference to expect when an application is bottlenecked in any particular scenario. How MUCH of a difference is required or expected to be able to point to a conclusion either way? From my perspective, both of HUB's Cyberpunk examples are equivalent situations in terms of the hardware setup they have and thus no different conclusion can be made...
Look back at my Spider-man example: the difference between frame presents and GPU Active is 0 ms for the very certainly GPU-bound 4K native. But at an internal 1440p (DLSS Quality) is is now 0.2 ms. Is this "small, but permanent, difference" now indication of a CPU bottleneck? Are the framegen results CPU-bottlenecked? I would most likely reply - "I don't think so... but I don't know for sure".
Thinking about it logically, framegen at 4K is interpolating frames from a GPU-bound environment - therefore, the framegen is most likely still GPU-bound - the underlying environment is not *fixed* through the enabling of the feature. Rendering at 1080p is a CPU-bound environment and I do not believe that the magic of framegen will actually alleviate that. However, BOTH results have a relatively large difference between frametime presents and the GPU active value.
Which, I believe, cannot be understood to be CPU-limited in both scenarios!
 |
| Comparison of the benchmark runs in Spider-man between 1080p and 4K (native vs framegen)... |
Why is this such a problem? Because GPU Busy and the aspect of deciding how much difference is appreciable and meaningful is just like asking the tongue-in-cheek question of: "How long is a piece of string?"
Just as my prior discussion on FPS metrics reporting tried to highlight, a stutter due to a longer frametime is relative to the average frametime surrounding it. GamersNexus defined a stutter as any deviation above 8 ms between successive frames. However, this also ran into the problem of absolute relative nature - 8 ms from a 33.33 ms (30 fps dropping to 24 fps) average is not the same as going from 6.94 ms (144 fps - dropping to 67 fps)... This is one of the reasons I use 3x the standard deviation of the frametimes when I'm not using a static/locked display framerate.
This point of view is backed up by Unwinder - the person behind RTSS development. They have decided to set a particular ratio limit to tell the user when they are or are not CPU/GPU limited. This, currently, is defaulted to GPU Active being 0.75x of the average framerate value. However, as they are happy to point out, this is purely a guesstimate but that a GPU limited state will be achieved when the ratio is as close to 1 as possible.
 |
| RTSS adds a user-editable value to "define" when an application is or is not CPU/GPU limited... |
The problem, here, is that I can prove this assertion wrong.
When I was recently testing Starfield on two different platforms, I was able to get a GPU Busy difference of 0.4 ms on my AMD system (0.97x ratio), showing, in theory, that my GPU is the bottleneck. Unfortunately, I already have data showing that on my Intel system, which performs >5 fps faster in both minimum and average fps that the GPU is also the bottleneck, with a difference of 0.1 ms (0.99x ratio) - quite embarassing to find out my GPU is cheating on me!
Am I actually GPU limited now? From the data, I'd say I'm close to it... but from other people's data I'd have to say I am not! Tom's Hardware were getting 8 - 10 fps more than I am on an i9-13900K platform... and I find it hard to believe that performance is now worse after various patches...
So, clearly having a GPU Active time near to the frametime value does not provide the user with any indication on whether the application is actually GPU bound or not!! Especially when we begin to factor various factors like upscaling and frame generation into the equation and when we begin to look at factors relative to absolute values with respect to smaller numbers. (i.e. 0.75x 33.3 ms is a much larger value than 0.75x 16.6 ms)
What you can do, though, is see from the graph that there is more variation in the frametime test data - indicating that there is a CPU/system bottleneck to performance. Unfortunately, this data was available before the introduction of GPU Active! So the logic of even including this metric is a bit opaque to my mind.
 |
| Frametime data from New Atlantis test run... |
There is also another concern regarding the amount of data logging happening which may affect the results on lower-end or bottlenecked systems. However, I can't speak to this particular worry...
So, where do *I* think things are going wrong with the introduction of this metric?
How it Should Have Happened...
A benchmarking tool, like GPU Busy needs to be used in a highly regulated environment where the user (or programme) knows what is being tested. i.e. GPU Busy should only be used in a known benchmark programme environment.
Part of this comes down to the fact that, as I pointed out above, there are too many unknowns involved in the use of GPU Busy - and each particular application and resolution and in-game settings, combined with the hardware being tested will define what the meaningful difference between frame presents and GPU Active time will be; In one application, with one set of hardware, a 0.2 ms difference will mean the system is CPU bottlenecked, in another, it might be a1 ms difference.
Added to this uncertainty, each CPU/GPU pairing (and the average framerate achieved during the benchmark) will also define what the meaningful difference is between the two numbers. Essentially: no two benchmarks can be compared, and no two hardware setups can be compared.
That intrinsically limits the usefulness of the metric.
Further to this, aside from being used in a standardised environment, documentation, descriptions of functionality and specific workings should be provided (they were not when I checked) and more importantly, perhaps, the metric should be explained in terms of being able to understand its use and legibility with concrete examples!
As I pointed out above, nowhere is it defined at what point you become CPU or GPU limited except at the extremes of the potential range - but this, of course, feeds back into the point that GPU Busy is a 'dumb' metric that does not understand its environment!
How can a <1 ms difference in between presents and GPU Active cause any sort of analysis to be mulled upon? Upon what criteria is that based? Furthermore, how can the ratio of 0.75 between the two be defined as the arbitrating factor? Or, for that matter - any other ratio one might choose! What is the justification and the logic for those arbitrary cut-offs? How much visibility or understanding will the end-user have of these arbitrary decisions by integrated tool-makers?
As a result of all these issues and concerns, GPU Busy and its use for benchmarking or analytical use will remain a snakeoil product until more control is exerted over it. Results and conclusions deriving from this metric should not be trusted.
GPU Busy is not fit for purpose in its purported use case.
The End...
There is one more facet to this fable of faux pas - undoubtedly, GPU Busy will result in many wrong online conclusions in discussions between users with many using the metric to reinforce their point, not realising they are standing on sand... GPU Active / "GPU Busy" requires much more analysis than simply looking at the frametime graph differences between that value and the frametime presents value - in fact, in many cases, as I've hopefully pointed out in this article, it can be misleading in the simplicity of the message being spun around its introduction to the public.
2 comments:
The more I read, the more I'm convinced it'll >MAYBE< be useful SOME DAY in a highly controlled environment where MOE like for like can be compared between settings, as a tool for the benchmarker to narrow down if/how specific settings vary the results between benchmark passes. And that might become useful for deciding what settings to use in future benchmark tests.
But for presenting to the end user as something they could compare to their own system? Doubtful.
That's probably what its true purpose is... but, as you say, unless you have a lot of hardware you can throw into some sort of database, it's not that useful on a single set of hardware in a single game. At least, IMO, maybe that will change!
Post a Comment