 |
Recently, I've been on a bit of a tear, running around trying to get people to listen to me about what I believe is a better way to analyse the performance of individual games, as well as the hardware used to run those games than is currently being performed by the vast majority of hardware reviewers in the tech space...
As with all new ideas, things are still developing and I'm still choosing what to keep and what to drop - what works, and what doesn't. Today, I'm going to summarise the conclusions I've come to, thus far, and also introduce a new concept that I feel like everyone in the tech space should be doing. However, some are getting it wrong: wrong to SUCH an extent that it literally took me a while to double check the concept because I can't be the only person to have realised this over the last ten years...
What works...
The journey started back in 2021, listening to a Techdeals video. Sure, Techdeals has kinda fallen off the deep end in the intervening period, but his thoughts on frametime vs stability vs presenting that information to the consumer of a tech/game review got my neurons all fired up.
This was surely a solvable problem!
We've gone through advancements in presentation of benchmark data (heck, even with the benchmark process and best practices!) before. Why not another time? So, I set myself this goal - to try and understand what is important in benchmarking data and how to further improve what we have.
 |
| The germ of an idea... |
The first time I managed to get my act together was for the review of Spider-man's performance, almost a year later. I was spurred into action when a load of people claimed that performance was better with hyperthreading off on the CPU. Intial probings by just screencapping weren't working... a snapshot doesn't capture an experience! So, I went back to that idea and made it work... mostly.
Things weren't 100% right.
Sure, I think the frametime differential graphs are really easy to read by the consumer of the data. They are great for doing comparisons where the difference observed can be large. They are not so great when you have a lot of data to compare (e.g. when testing multiple GPUs): you lose clarity when too many plots are overlaid upon each other.
The idea of using process performance and demarcating a control space within three standard deviations of the average was also good... but, again, we're talking about a single CPU/GPU combo. Though, I haven't given up on that idea just yet, I need to spend more time to see if it can be utilised outside of narrow applications - as was the case for the Spider-man analysis.
One thing I absolutely effed up were the static numbers: instead of comparing frametime numbers, I was converting everything into calculated "fps" from those static frametime numbers. From then on, I moved to speaking about frametimes - and that lines up with the analysis I do when using frametime differential plots to see the actual smoothness of the game running.
From that point on, when I was performing my RAM testing, I also began using the median frametime value in order to show a bias from the average for which the player will experience - will it be better, or worse? I also combined this data with the natural log of the frametime in order to have a visual reference for this bias: Is the distribution normal? How narrow is the peak? How high is either "end" of the plot? Each of these visual aspects has a bearing on how "good" the performance of the application is within each given test.
 |
| Yes, with this many experiments, the frametime differential plot becomes messy. The ln(frametime) plot becomes more useful... |
It was around this time that I began to want to focus on the user experience of achieving a given performance level in a game. E.g., The player is using a 60 Hz monitor, how stable is the presentation of the game with "X" hardware when targetting that refresh rate?
So, summing this all up, I have the following conclusions:
- In general, it is preferable to speak about frametime consistency than frames per second.
- Visualising the frametime consistency can give a better user understanding than static numbers.
- The statistical tools for process performance can work well to understand how well a hardware combination can meet a performence expectation from the user's side.
- Applying the concept of process control through PpK/CpK.
Now to get to today's new topic: percentile fps numbers.
FPS Metrics...
The reason that it's better (and safer) to speak about frametime numbers is because these are actual data that is provided to the reviewer/user by the hardware and software combination under their control. However, the whole point of gaming, much like movies and TV shows is that we want to create the illusion of fluid movement from combining a stack of still images.
Get the the number of still images high enough per period of time and humans no longer experience the images as individual, but instead stitch them together into moving dioramas. This is where things get a bit murky.
The concept of refresh rate is pretty simple. You have a certain number of presentations on the screen per second - usually measured in Hertz. But what about frames per second? How are you measuring that? By definition, it is an averaged metric but there are different types of averages we use in statistics to understand populations of data when certain criteria are met.
For the average fps result, it's easy: just divide the number of frames obtained by the total time of testing. However, one of the more recently (as in, for over ten years, now) favoured metrics has been 1% low fps, or something similar (e.g. 0.1% low fps). How is that number calculated?
Gamer's Nexus posted their methodology back in 2016 and they explained that they used the average of the "Xth" percentile frametimes to then calculate the "Xth" percentile fps number. It appears other outlets also have the same methodology - and applications like CapframeX appear to also use it, as well. This can be derived from work done by Scott Wasson over on Techreport back in 2011*, though I'm sure others came to the same conclusions separately.
Unfortunately, the images of the article are lost to the mists of time...
Further work was also pioneered by the team at PC Perspective - something which I have only very recently discovered. They were thinking deeply about this issue as well and applied a more nuanced approach than Techreport. However, Ryan Shrout had some different perspectives* on the issues we face in terms of understanding the output. He instead focussed on the output to the display and what the user will experience.
*Ba-dum-PISH!
This isn't incorrect by any means. In fact, I'm pretty sure this is a version of the type of analysis that Digital Foundry perform in their tech analysis. Unfortunately, this methodology precludes much of the userbase from any testing themselves as it requires quite a lot of knowledge in terms of using the software, interpreting the data, and access to not insubstantial amounts of expensive hardware in addition to the user's gaming rig.
 |
| In the use of process control, we define upper and lower performance limits through the use of the statistical tool of standard deviation... |
 |
| And the excursions above and below the UDL/LDL (or more correctly UCL/LCL) can be neatly tabluated... |
The issue lies in the fact that any frametime value is just a snapshot of the time to deliver a specific frame. It has very little relevance to the player of the game in terms of what they experience - unless there is a large sequential frame time difference, which will result in visible stutter - which is why I plot those frametime differentials!
Knowing that the game suffers from stutters IS an important piece of data for the consumer... but that can be presented as frametime data, not fps data.
Going back to the "Xth" percentile fps figures, since fps is a time averaged metric, it only makes sense to take the average of the player's experience around each frametime spike. The reason for this is simple - context. If you are running a game with a frametime of 16.666 ms (60 fps) and see a single frametime spike to 33.333 ms (30 fps), that means you lost a frame.
What was your fps for the period encompassing the frametime spike? 59 fps. Instead of getting 60 frames per second, you dropped one. Your fps didn't drop to 30 fps - the presentation of the game was only momentarily affected and, for many people, the loss of one frame out of sixty would not be noticeable. However, if you take the first methodology for describing "Xth" percentile figures, if you were asked the minimum framerate, you would have replied 30 fps... which is false. You never experienced a period in the game where you were presented with 30 frames in a 1 second period.
 |
Other outlets, such as Digital Foundry, Tom's Hardware and Techspot/Hardware Unboxed appear to use an averaging technique. This makes sense - as pointed out above, if you're talking about a time-averaged metric, you should time-average it, not percentile average it!
However, this assumption is also fraught with danger because no one, and I mean literally zero publications I've been able to search (aside from Gamer's Nexus and historical PC Perspective*) actually report how they get to any of their metrics. Okay, I can see that the framerate graph for Digital Foundry is smoother than that for the frametime graph but what is the period of time that is being averaged? Is it a 1 second moving average? Is it 0.5 seconds?
*They do not use this methodology any longer...
Hardware Unboxed and Tom's Hardware, on the other hand, have no such visualisations (I haven't become a subscriber so I don't know if this data is available to them...) and, aside from being able to see a difference between Gamer's Nexus' results to draw the conclusion that they must be using a time-averaged process, the actual process used is completely opaque.
Now, I don't really blame publications for not discussing the ins and outs of their testing methodology aside from minor, very shallow, and generally understandable principles. The larger outlets have HUGE followings and many open detractors who associate their ouput with personal attacks on their favourite <insert sytem/game here>.
However, I am a scientist. This is what I do and experience from within and without the community on an almost daily basis. It's not easy and I can appreciate that... and it's why many institutions shield their researchers from the ravenous hordes.
On the other side of the coin, I also want and need to understand the output of such publications. As a scientist and as someone who generally likes to know they why of things, I also understand the people who want to question and reach their own understandings... So, having this important data obscured renders the output of all of these tech review publications into a "trust us" approach... which people tend to not enjoy, as Linus Sebastian found...
While I'm not a pitchforks and bile kind of person and I am pretty forgiving of circumstances, I really want the quality of hardware and software reviewing to improve even further than it currently is. I'm not "calling people or publications out" here. What I am doing is questioning the status quo.
Why? Because many publications have since regressed to displaying or discussing only the average fps when speaking about different setups. It's not the complete picture and it's not really the best metric to be focussing on, in my opinion.
I believe that my suggestions, in part or in full, can aid in public understanding of the performance of a given hardware configuration within the tested software. But it needs adoption and understanding... and explaination.
So, I will now attempt to illustrate it with some examples...
 |
| That looks pretty messy - but this was before the v-sync issue was fixed and with RT on... |
 |
| The AMD system fares no better, here... |
E.g. You're Wrong...
Let's take some of the data I generated from the Hogwart's legacy testing that I performed recently. This will be used as just an example since I know that with this testing, HL had a problem with improper frame presentation when v-sync was enabled, data streaming was not optimised, and RT had a big hit on the performance of the systems. I imagine that the situation is a bit different as of today.
All data is presented here for your perusal.
If we were to take the data from the frametimes, we would get the results in the "overall" section in both tables below. This gives us the correct average fps but, if we take the percentile values as the average of the associated frametimes, without taking each of them into context, we see pretty dire "percentile" fps results.
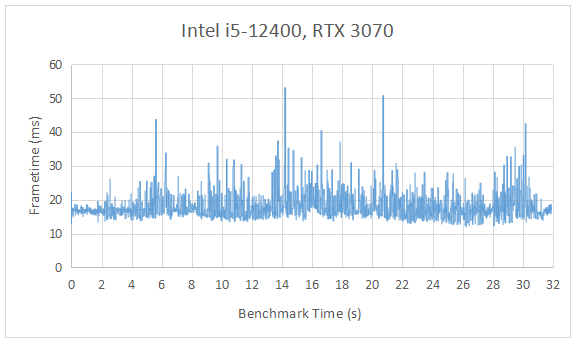
Taking a look at where the maximum frametime happens in the benchmark run, we are able to extract the second of data surrounding that datapoint. In the case of the Intel system it's at 14-15 seconds and for AMD, it's 29-30 seconds.
 |
| Data obtained on the Intel system... |
Of course, looking at the average fps for this approxmiate 1 second shows a completely different reality to the 1% low previously reported for the average of all the data, using the singular frametime data points to do so...
For the Intel system, we see an average of 50 fps and AMD 59 fps. So, in reality, there is never a point at which the player of this game on either system would experience a framerate of 18 fps or 21 fps. Stutters? Yes! Of course, we observe stutters. However, these are best communicated in frquency and severity in terms of frametime, not fps.
Then, finally, applying a moving average to the data - encompassing a 1 second period gives us the true, experienced reality from the perspective of the graphics card. Somewhere around 45-49 fps across the two systems for the 1% low fps values.
 |
| Data obtained on the AMD system... |
Lastly, knowing that the experience of the user is not related to individual events (in most normal working conditions) - as defined by Gamer's Nexus as ± 8 ms between frames* - we can change our analysis to a moving average. I've chosen a sixty frame moving average for this data since I am targetting sixty frames per second. If I had more coding skills, I would average the number of frames every one second. Unfortunately, as it stands, I am performing all of this analysis manually so this rough approximation can be applied to this dataset to get a feel for its use.
Further refinements can, of course, be applied!
*Personally, I feel like this is a bit tight and dependent on the display refresh rate (and whether the VRR feature is present or not)...
What we immediately see is that the user experience from the standpoint of the GPU is much smoother than when taking the individual frametimes into account. There are definitely no periods were we are seeing 22 - 30 fps on either system. These are nonsense numbers that should not be communicated to the consumer of a review!
What we DO observe, though, is that the worst period of performance may not actually be where we thought it was... Consider the periods we defined before as the worst. For the Intel system, it was the 14 - 15 second period. For the AMD system, it was the 29 - 30 second period. The understanding for the Intel system was pretty much correct. However, the AMD system now also experiences the worst performance at this same period.
Clearly, from a logical standpoint, this makes sense.
The section of a game benchmark that is heaviest is irrelevant to the hardware you have to throw at it. How the hardware deals with that section matters... The other benefit of changing to a moving average is that it removes the random frametime spikes we were observing in Hogwart's Legacy from the equation. They are an important data point for the user, for sure... but they are not related to an average experience.
 |
| Sure, we get a lot of frametime spikes, but we can see that the outputted data from the graphics card per second is nowhere near as bad as those erroneously reported data would be... |
 |
| On average the AMD system is performing better but has that huge bulge between 14-16 seconds... but that wasn't identified as the worst frametime experience? |
The final problem with all this analysis, is that that we have some time between the frametime presented and to that actually displayed. There are, as Ryan Shrout points out in his explainer article linked above, times where rendered frames are discarded by the system as a whole because they fall between (or outside) of the required refresh rate of the display.
This is where reviewers like Ryan/PC Perspective and the people at Digital Foundry and NX Gamer come into their forte with analysis tools, external to the system in question, where the experience of the gamer can be qualified. They have the absolute "ground truth" of the experience down to a science.
But what if we could approximate that and simplify it for the general user in a way that would not require massive amounts of overlayed graphs? For me, that would enhance the data that other tech reviewers pump out at rates that defy anything that the more detailed and thorough analysis can maintain.
Luckily, Frameview (the tool I am using) has an approximation for what is sent to the screen from the graphics card.
 |
| The data for the Intel system, fitted with the RTX 3070... |
This is as close as you can get to the absolute ground truth user experience without using external lossless capture hardware and post-processing analysis software. For my example, here, we can see that by defining both a specification limit of 3 standard deviations from the average frametime (USL/LSL) we can observe the areas of the benchmark run where we encounter the difficulties in experience presentation to the user in screenspace.
i.e. Wherever the frametime differential spikes cross the dotted lines, we see worse presentation of the application to the user.
The Intel system is struggling to maintain a consistent output throughout the benchmark, with many skipped frames and periods where fluidity is lacking. The individual frames are not as much at issue, as prolonged skips where multiple frames are missed (e.g. around 14 - 19 seconds there are four periods were 3 sequential frames are missed).
By comparison, the AMD system manages the benchmark reasonably well, though I would say just barely! The system is running the edge of the USL/LSL throughout the benchmark run and, as a result, manages to maintain the presentation to the user observing the screen more consistently. (This is a more powerful GPU with more VRAM!).
 |
| The data for the AMD system, fitted with the RX 6800... |
I have also defined a control limit (UCL/LCL) for the process as the median of the frametimes ± 3*stdev of the frametime differential. This is something which is arbitrary and could be tightened but not below the baseline 3 stdev from the frametime average - this is more just a tool to see if the process is in control. We would say that it is not in this scenario...
As I mentioned above, we cannot present all this information for comparisons of multiple graphics cards - it just gets too messy. It's fine for individual tests or comparisons. However, by measuring excursions below and above the USL/LSL, we can adequately quantify the performance of the benchmark data for each piece of hardware.
So, Where Does That Leave Us...?
Using these methods and types of analysis, I believe that we are able to approximate the ground truth user experience with minimal investment of hardware, and with the appropriately designed automated spreadsheet or application, the analysis could be performed for the user, themselves.
An application like CapFrameX could easily incorporate these ideas or, at the very least, correct the issues with data presentation that currently exist in the application's current form.
So, what would presentation of review data look like with these ideas in mind? Well, I've drawn up a simple bar chart below to present this concept. The average fps are unchanged, but the minimum fps are now incorporated as an averaged statistic - meaning that the user will experience this fps over the course of 2 seconds (1 second moving average). The maximum frametime spike is presented to show the absolute amount of stutter that could be expected and the consistency of the presentation in frametimes is represented by the deviations above or below the USL/LSL (3 standard deviations from the average).
 |
| This bar chart covers all the major aspects of the testing - highest frametime spikes, average fps, minimum experienced fps, and process controls... |
In order to make sense of this new presentation style, I will now go through the summary of this data in order to give a simulated reviewer's context:
Overall, the AMD system performs better, with a higher average fps closer to the system refresh rate of 60 Hz. Minimum experienced fps is actually better on the Intel system, though stutters are also considerably worse on that system as well. The AMD system is more performant, with consistently lower frametimes than required to maintain a 60 fps average, though it is - overall - not achieved in this benchmark.
And that, is where we leave this point in my understanding. This isn't the be-all and end-all - this is a journey to improvement. I don't consider myself 100% correct - some of this is open to interpretation, as much as the human experience is. However, I hope that I have demonstrated some aspects of current hardware and software testing methodology that is, in my opinion, lacking and actually incorrect.
Maybe this post will inspire or inform someone else to actually change their interpretation of data. I can only hope!
Until next time...
No comments:
Post a Comment