 |
| Who runs 3 dimms?! |
Over the last two entries, I've taken a look at the effect of RAM speed, latency and bandwidth on a few gaming applications as well as synthetic gaming benchmarks. Across a Zen 3 and Intel 12th gen platform, I found that DDR4 memory optimisation had effectively zero effect on the minimum, average, and maximum fps values in the applications tested.
There were those pesky fluctuations in Unigine's Heaven benchmark scores and random-looking maximum fps waverings in both Spider-man and Assassin's Creed: Valhalla that could be explainable by conventional wisdom; manual-nature of the Spider-man benchmark; run-to-run fluctuation in Valhalla and Heaven's case... but I'm not content with that.
This time, I'm going to try and apply a statistical look at what I've obtained during the testing of Spider-man for all the various memory optimisation testing I performed in order to see whether I am correct in wanting the review industry to take a more statistical approach to reviewing hardware and software.
The law of averages...*
Now, we are often tempted to sit back and look at all of the data and say that the raw numbers tell the story... but the counter-intuitive thing about statistics is that data often lies - and it lies the most for small datasets, and comparisons of large numbers with small numbers.
I've tried to make this point across several media outlets over the recent years but I've yet to actually have a reply to any of my comments - I'm just not a big enough personality/force to accomplish that. However, if you're here, then please stay awhile and listen.
There actually has been a positive trend in recent history and I'm happy for it. On the one hand, we have outlets like Digital Foundry and NXGamer that have increasingly stressed the importance of frametime and per-frame variance in the smoothness of presentation to the player. Additionally, sites such as TechPowerUp have integrated an fps plot into their review data, though I do think that they are misinterpreting the difference between fps and frametime in their analysis*. Similarly, Guru3D is also mixing up fps and frametime in their analysis but, worst for me is the presentation of this data without context**: What is the point of a frametime graph showing the presentation of frames for the user without showing it in the context of the other hardware reviewed?
*Their binning of "fps" does not make a lot of sense in this context since fps is an aggregate value, not a metric that can be binned because there are no "frames" that are 60 fps. Hence, IMO, they should be binning frametime instead...
**Now, I know I'm not perfect here - I've also made the same mistake... but I haven't been doing this since 2013! Nor as a full-time job :)
While these are steps in the right direction, they are typically presented as-is, with no further analysis and statistical leaning - unlike what happened during the 2010's rennaissance of average, 0.1% and 1% low coverage in reviews.
The big problem, as I see it, is that people are ingrained to rely on average metrics. That actually wasn't such an issue over the last ten years because both AMD and Nvidia were struggling to get their frametime delivery down to a consistent experience. Added to this, despite huge gains in performance over that time, we actually weren't in the position we increasingly find ourselves in gaming, today: CPU bottle-necked territory... where we just can't feed data to the GPU fast enough - whether that is the fault of the specific game engine or limitations of the installed hardware.
 |
| Dying Light 2 is the first game benchmark I'm aware of that is focussing on the median fps value instead of the average... [Via CapFrameX] |
There is the other side of that coin as well, with increasing parallelised resources on the GPU, we are in a situation where there could be issues adequately scheduling or utilising those resources which will present inconsistent frame times within any benchmark that is run and this has a chance to bring truth to lies through the average metrics we currently use in reviews.
It is obvious that an average result with a smaller standard deviation or value spread than another, identical average with a wider spread and larger standard deviation will be better. One result (the average) is literally equivalent to the other but the overall experience is not equivalent.
As I mentioned, one way this can be ameliorated is through use of focussing on frametime average, coupled with the standard deviation of that dataset. Another way it can be brought into contrast is through coupling it with the median fps or frametime value. Alone, as per the Dying Light 2 benchmark, the median can distort the actual data but when combined with the average, we can see which way the performance during the benchmark actually leans - either towards better performance or worse. It can provide a sort of 'clarification' of what actually occurred by saying, "Yes, we had some dips in frame rate, which gave us a lower average but, overall, the experience of the user was higher..." Which is generally the case.
Combine that information with the 1.0%, 0.1%, or minimum lows and you have an even better picture of performance than you do now.
And that's the easy fix.
To further move on from the rut we've found ourselves in over the last ten years, we need to step deeper into statistical analysis of the data we generate during benchmarking. CapFrameX, has developed a tool after my own heart. I would say that is potentially 80-90% of where I want to go. So, for a more simplistic understanding, I think it's a great improvement over what the general public has access to at this point in time.
What I really want is to be able to apply the principles of process performance to the benchmarking industry.
 |
| I'm not currently best set up to deal with graphical comparisons (I just don't have the time!) but I sure can work those spreadsheets... |
Which way is up...?
The one criticism that I have of the hardware review industry is that they are entirely reactionary: it is often the case that the results of testing are uncritically accepted. It's not a complete criticism, it does sort of go with the historic expectations of the genre of reviewer. However, I do believe that oulets like Digital Foundry and NXGamer have begun to epitomise the opposite and push back on this concept with a rather simple premise:
"What do we expect and how does the hardware perform with those expectations in mind?"
This question is essentially just a small step away from the objective of process performance. Process Performance is an idea that has been around for a long time but which has become honed by the technological innovations in the late 20th century. In my own industry, the focus is on producing items within a range that complies to a specification. That specification may already be tight, but we (ideally) have a process that can produce it with minimal deviations and thus avoid rejections or quality problems either at release or beyond.
In a gameplay/hardware review perspective, this logic applies in a different manner: What are we targetting and can we achieve that performance?
This works well from a console perspective (which is why I believe that these two outlets in particular are positioned well for this sort of analysis) but on the PC side of things, we are so used to just "accepting" whatever we are given and then letting the user do all the actual assessment of performance themselves. In my opinion, it's a bad combination...
Whereas a console game reviewer would have in mind that a particular game should reach 30 or 60 fps on average in order to satisfy expectations or even just basic standards, PC has no such application of logic to how hardware performs and this is a problem when we take broad and blunt statistical tools like the average, minimum or 0.1%/1.0% low fps numbers.
Worse still, we typically combine the best CPUs available with all GPU hardware (and vice versa) when these conditions are not the norm for the vast majority of hardware configurations. As a result, most hardware reviews are essentially useless for 90+% of the target audience... Unless you're going to tell me that hardware reviewers are actually targetting only the top 10% of users?
There is, of course, nothing wrong with reviewing hardware with a view to analysing its theoretically optimal performance but there can arguably be more value to the consumer to put that hardware in an appropriate setting and assess its worth from that perspective.
I will say, however, that I do not see any easy solution to that particular problem. Both NX Gamer and Digital Foundry already provide "realistic" or "mid-range" hardware setups as part of their PC analysis of game performance and that appears to be the only workable solution in the meantime before some other sort of AI-based conjecture or bulk automated testing can replace it... or Hardware Unboxed spend their limited life-force determining it...
The rest of the hardware reviewers are essentially only performing "best case scenario" testing... and oftentimes, not even that!
 |
| If only there could be some sort of standardisation in these huge dataset comparisons! Only Hardware Unboxed appear to be able to do so consistently... |
Getting to it... Defining the parameters of assessment...
I appreciate you've been patient until this point, dear reader*. So now I will address what I actually came here to present.
I've laid out my objections to how things are currently done so let's apply what I believe are the three tenets from which we can derive the full picture (at least as is humanly possible!)...
*Though I suspect you just jumped down to this point in the article...
First off, forget frames per second. I think that this fad is dead. In the era of the RTX 40 series and RX 7000 series, we are in a position where basically any game can be run at 60 fps at 1080p with maximum settings. The only obstacle is price of components, which continues to be a huge problem for user uptake.
I've already covered the fact that fps is an averaged metric which cannot be analysed on anything other than a moving average... and that is not useful when all hardware performs essentially identically for the average user. The focus on fps also hurts trying to understand the actual performance of specific hardware in a game as it will unhelpfully remove spikes in frametime from consideration. Additionally, you cannot describe "the fps" of each frame. It is a nonsensical argument.
Secondly, look at the shape of the frametime curve - look at the normal* distribution of the data and observe how it leans either to the smaller or larger values... If that is not possible, compare the average to the median values and work from there.
*Or as normal as it is possible, depending on the hardware in question...
Thirdly, work with the frame-to-frame differential time of the dataset. Determine the average or median value then describe an acceptable working space around that value*. The most consistently presented frames will bear out, showing the smallest standard deviation and frame-to-frame difference, along with the lowest numbers of excursions above and below those self-set control limits.
*For me, as standard practice, this is three standard deviations from the value in question...
Finally, from the data gathered, you can also choose to derive your process performance by defining what you consider to be acceptable performance. Whether that is a range of 60 - 120 fps or more narrow. This can be used to track minimum or 0.1% (etc) lows in order to satisfy an actual usable range of GPU frame-to-frame performance.
On to the data...
Just as a reminder: for this particular analysis, we're looking at the performance of Spider-man: Remastered on PC with an RTX 3070 paired with an R5 5600X and i5-12400, across a range of RAM speeds and latencies. This fine-grained analysis will hopefully show what is important in RAM speeds in the mid-range hardware performance for a game that is notoriously heavy on both the CPU and GPU, given that many comentators are often calling for reviewers to use faster, lower latency RAM in their reviews, as if it will give an advantage to one platform or another.
In the process of this, I hope to be able to show the value of this sort of analysis in hardware testing...
One thing to note, this testing will all be with raytracing disabled - that will follow in the next part.
So let's begin!
As per usual, there is a summary of the DRAM timings, latencies, as well as deviations from the "process" in the Google Sheet.
DDR4 3200...
 |
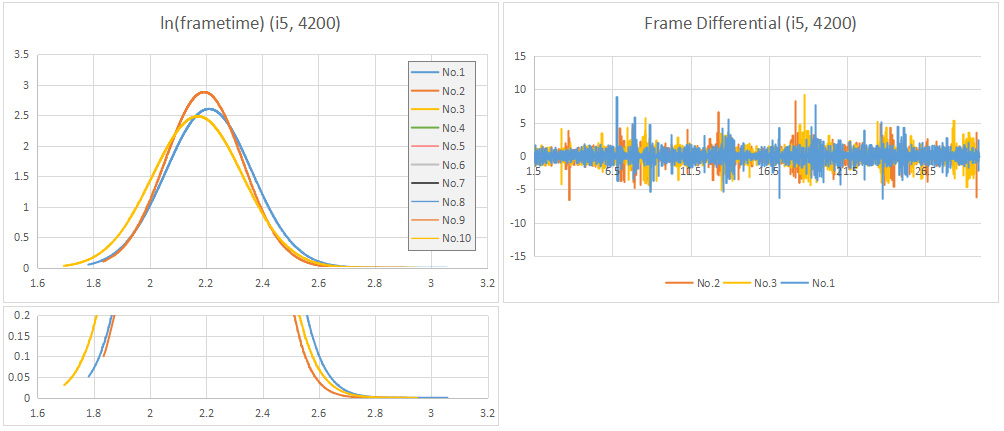
| ln(frametime) is in order of the tests performed... |
In this analysis, I will utilise two particular metrics:
- The natural log of the time, in milliseconds, between each frame.
- The per-frame differential in milliseconds.
There are two important features to note from the graph of the natural log of the frametime distribution:
- Height
- Narrowness
The more narrow the plot, the smaller the difference between the minimum and maximum frametime exists - i.e. the better a process performance the CPU and GPU there is for a specific application.
The taller the plot, the more frequent the values experienced by the player during the benchmark at that specific frametime.
With this particular i5-12400 plot of the natural log of the normal distribution of the frametimes exhibited during the benchmarks, we can see that the memory timings of plot 5 show a narrower and taller aspect than the other memory timings.
There is also one important feature of the sequential frametime differential plot for us to note:
- Variance from the average difference between sequential frametime.
What this means is that we want as few varations in individual sequential frame presentation as that represents an even or consistent frametime presentation throughout the experience.
This can be confirmed through the frametime differential, where we see that the per-frame control of the application, through the hardware is also the tightest with the memory timings of plot 5*.
*I understand that this will be difficult to read from the provided graphs, but the raw data is available in the link above...
 |
| ... whereas the frame differential is in order of worst performance to best (left to right). |
The mid-point of the frametime distribution (aka, something akin to the average framerate) is slightly higher (i.e. slightly lower fps) for the Ryzen but that is expected due to the higher IPC (Instructions Per Clock) and/or higher clock frequency that the Intel 12th gen CPU is able to manage.
DDR4 3600...
 |
Again, the best performance was no. 8 - neither the lowest latency or highest bandwidth.
 |
However, for Ryzen, the tightest memory timings resulted in the best outcome for the player - though this also was not at the lowest latency or highest memory bandwidth that was achieved at this memory speed...
What I will note, is that, overall, frame differential is better on the Intel platform, across the breadth of the timings tested.
DDR4 3800...
 |
At DDR4 3800, the memory timings with the lowest latency finally win-out.
 |
However, it's not the same story for AMD: at DDR4 3800 1:1, the tightest timings result in one of the worst performances because they present to the player in such an inconsistent manner. Sure, those timings result in the highest "average" fps recorded but, in terms of consistency, slightly looser timings actually win-out!
This is an especially egregious case of the 'law of averages'. People love to spam the average fps and 1% low metrics but this is a case where you can see that the curves do not match that presumption... The average can be higher but there is a higher variance in frametimes, resulting in a worse user experience...
DDR4 4000...
 |
I have fewer data points for this memory speed but the lowst latency and tightest timings result in the best performance, regardless of the fact that this is a 1:2 ratio of the memory controller to the memory frequency.
 |
This time, the Ryzen system also adheres to this same principle... but, once again, the AMD CPU is providing a worse overall frametime consistency across all settings tested, despite being at a 1:1 frequency ratio with the memory controller.
DDR4 4200...
 |
At DDR4 4200 (gear down mode - so 1:2) the i5-12400 shows a more consistent performance with the memory timings which are not the lowest latency or with the most excursions beyond the process control limits... What is interesting here is that the average per-frame differential and standard deviation of those frame differentials is the smallest (for this dataset), meaning that the most consistently presented image/gameplay is for the middle option.
 |
There are no comparisons to be had from the Ryzen system because tighter timings were not able to be obtained with the amount of effort I was able to put into the testing... However, the amount of variation (as measured by the standard deviation) is very similar to the Intel system - just 10 fps behind on average, with a similar amount of frametime variation.
DDR4 4400...
 |
 |
There are no real discussion points here, other than what we can see as a result of the increased performance of the Intel 12th gen chip...Regardless of the increased bandwidth and whatever latency between the two platform setups. Only one slight thing of note is that, once again, the 12400 has an overall better frametime consistency...
The best of the best...
 |
In this comparison, we look at the best memory timing setups of each individual platform and setup. Once again, while we get better averages and maximum framerates with increased RAM frequency, what we actually see is that the best performing timing setup is the DDR4 3800. While the other frequencies are not bad, or much worse, the 3800 is the least poor in terms of frame-to-frame variation.
What is apparent from this data is that a major feature of the Intel platform is that moving from a 1:1 ratio of memory controller frequency to RAM frequency to a 1:2 ratio does not have a large or negative performance impact.
 |
In comparison, AMD's platform has a higher sensitivity to both RAM frequency and IMC ratio: 1:2 is clearly penalised with worse performance. Additionally, the 5600X has worse overall frametime consistency across all memory frequency and timings tested, compared to the Intel system. Sure, we're not talking a huge difference - we're talking the difference between consistently breaking a 5 ms frametime delivery difference and not.
Meanwhile, the DDR4 3800 best timings won-out in terms of the average, max and minimum metrics... but these timings are nowhere near the lowest latency on offer in this testing comparison or at the highest bandwidth.
In conclusion...
What is apparent here is that neither Intel or AMD system have their best performance at the lowest latency of either RAM or system level memory access... nor with the highest theoretical bandwidths.
What is also clear - though not necessarily widely testeed with this particular dataset, is that RAM quality has a big part to play in the observed memory performance. Looking at equivalent memory quantity between the Corsair (Samsung C-die) and Patriot (Samsung B-die), we can see that the better memory quality (B-die) performs better in all aspects at the same memory timings. This is something that may be apparent in the overclocking circles but not something that I've personally seen or been exposed to. In fact, this is a bit of a low-key shock.
The immediate take-away from this is that, no matter what memory speed and optimisations you wish to use, using the best-binned memory integrated circuit (IC) RAM sticks will yield you the best results - regardless of memory timing optimisations...
...which is a rather sad take-away from this whole debacle.
Comparing this data with the optimised RAM timing setups I analysed, we can see that any user can obtain similar performance in terms of frametime consistency and average framerates with most RAM frequencies with favourable ratios to the IMC of the particular CPU.
What we can say here is that messing around with memory timings and increasing gives you beween a 5 - 10 fps difference on average, with a difference of 5 fps on the lows for the mid-range Intel systems and a pretty bad up to 20 fps difference on the lows for the AMD mid-range systems.... when taking into account 1:2 ratio - i.e. DO NOT USE 1:2 ratio for AMD CPUs!
The essential take-away is that you should buy the best quality memory, even if it's with worse "timings" or "speed" than others as you will have a more consistent and higher fps performance! For DDR4 that's Samsung B-die. For DD5, that will probably by SK Hynix A-die (though I am not sure that there is a 100% concensus around this yet)...
Sure, the differences observed here might be larger on stronger systems that utilise top-of-the-line hardware, but that defeats the point of this analysis - the majority of people will be on mid-range or lower specced systems and they absolutely should not bother with wasting their time on optimisation of their memory systems...
Was I right..?
Looking at this data, was I correct in calling for reviewers to start taking into account process performance and more detailed statistics? Well, yes, I think I was correct - use of the standard deviation, and the ability to see frametime deviation gives us a more nuanced picture of a game's presentation to the player. In the process, we can see that average, maximum and minimum fps values actually have very little relevance in modern gaming due to the huge potential difference between GPUs, graphics APIs and game engine presentations.
I really believe that a stronger statistical approach, especially once refined, will provide a better understanding of game and hardware performance for both reviewers and players alike... We just need to get to that point.
Next time...
Believe it or not, but there will be one more entry in this series. I just didn't have enough time to put all the data together for the ratraying performance in this game... and I think that data may still have some value above and beyond that obtained for the non-RT performance.
No comments:
Post a Comment