 |
| Yes, this is an RDNA 2 card, I wasn't able to create a new one with RDNA 3 just yet... |
Much was made about the performance uplift (or lack thereof) of the initial RDNA3 cards released by AMD. Navi 31 (the RX 7900 XTX and XT) failed to meet expectations - seemingly both internal to AMD and externally (for various reasons) - this lack of performance also extended to the RX 7900 GRE which, despite lower core clocks, still underperformed compared to where it could be calculated that it should be...
Disappointingly, Navi 33 (the RX 7600) performed exactly the same as the equivalent RDNA2 counterpart, the RX 6650 XT, showing that there was zero performance uplift gen-on-gen in that lower tier part...
In the meantime, rumours swirled that Navi 32 was going to be 'fixed'. So, what is the truth of the matter? I intend to investigate a little and get to the bottom of the situation like I did with my Ampere vs Ada Lovelace performance uplift analysis...
Ours is not to reason why...
Much like the RTX 4070 VS 3070 comparison, there is a large overlap in "equivalent" hardware features between the RX 7800 XT and RX 6800.
The on-die cache structure is a bit different, with L0 and L1 doubling in size, and L2 remaining the same. L3 cache is decreased in size from 96 MB on the RX 6800 to 64 MB on the RX 7800 XT, with the caveat that it is also a chiplet design so the cache is not located on the primary die - which increases latency of access and worsens data locality...
Last time, I theorised that the dual striped memory configuration - with the L3 cache split across multiple chiplets feeding from multiple separate accesses to the on-board memory chips would lead to inefficiences and this appears to be confirmed in my testing on the product, with increased latency occurring before the cache size is reached (seen below around 48 MB). The decreased locality and increased management overhead of the data leads to delays in delivery or access to that data. Meanwhile, the RX 6800 with the on-die L3 only begins to increase latency of access once the cache buffer is exceeded.
 |
| I experienced some issues with data testing into the GDDR memory access, not sure why. However, we can see the improved latency for the 7800 XT within on-die cache... (From Nemez's GPUPerfTest tool) |
Other than that, all other elements are similar from being physically present in the device - RAM, number of compute units, etc.
What has changed in a more significant manner is the dual-issue design in the compute units and the uncoupling of the front-end operating frequency from the compute portion of the die.
These changes mean that, potentially, there's better throughput of instructions through the compute units in particular scenarios but also that while those compute portions of the die operate at around 2.4 GHz, the front-end operates towards 3 GHz - cutting down on latency of issuing those instructions.
As outlined in the introduction, we haven't seen either of these innovations provide much uplift in the products prior to those based on Navi 32, so lets see if that's still the case with this silicon...
Setting Up...
The base of my test system is as my recent Alan Wake 2 technical analysis:
- Intel i5-12400
- Gigabyte B760 Gaming X AX
- Corsair Vengeance DDR5 2x16 GB 6400
- Sapphite Pulse RX 7800 XT
- XFX Speedster SWFT 319 RX 6800
However, special considerations are given to the two GPUs, here. In order to level the playing field as much as possible, I've used the Adrenaline software to corral the core clocks of each GPU to be as close as possible to 2050 MHz. Unfortunately, the user ability to take control of modern Radeon GPUs is nowhere near as easy or precise as it is for Geforce cards, which means that I have not found a way to lock to a specific frequency - only control within ± 50 MHz. These small fluctuations should not really affect the outcome of this analysis but I wanted to make the note upfront.
Memory is another problem - AMD have the frequency of the memory so locked down that the user cannot force the memory below or above spec without the card placing itself into a safemode (circa 500 MHz core clock lock). This essentially means that the closest I could match the memory between the two cards was with an overclock on the RX 6800 to 17.2 Gbps and keep the RX 7800 XT at 19.5 Gbps (stock).
 |
| Both cards increase slightly but the RX 7800 was unable to be clocked high enough to reach a plateau... |
With this information in hand, I took a quick look at the effect of memory scaling on the two cards. With the synthetic benchmark, Unigine's Superposition, I saw that both cards had a slight increase in performance with increasing memory frequency.
The 6800 plateaued-off after a 100MHz increase, but I wasn't able to push the memory on the 7800 XT much further, either, as it quickly became unstable.
Thinking it might be a power-related limitation, I re-performed the test with the maximum power limit to the board. The GPU core, itself, was positively affected by this change - showing that the 7800 XT is power-starved, but the performance due to memory scaling did not really improve (though it became more linear).
This implies that both cards are working near their optimum memory frequency, as-is.
 |
| Memory speed really has no effect on application performance for the RX 7800 XT... |
Translating that into a "real" application, in the form of my old standby, Metro Exodus Enhanced Edition, showed zero performance increase as memory frequency was lifted. In fact, due to errors introduced at the higher frequencies the RX 7800 XT's performance started to drop off.
I didn't import the graph here but the RX 6800 saw no drop in performance - it was just flat at all memory frequencies...
Much ado about something...
Moving on, I looked at the performance of the two cards in several gaming applications, limited as mentioned above.
In the less demanding games, I tested at 1440p - moving to 1080p for the more demanding. However, really and truly, a current generation €600 card should be able to play modern games at native 1440p. We'll see that isn't always the case, which is a shame...
 |
Returnal and Spider-man typically show low gains on the order of 6 - 9 %. However, ray-tracing for Returnal has a 15 % increase in 'iso-clock' testing. Both games are considered relatively light on hardware so these increases, while real, are small in raw fps benefit.
On the other hand, Cyberpunk and Hogwarts Legacy, traditionally graphically heavy games to run, show typically consistent gains above 10 %, with only the broomflight test dipping below that. This is most likely due to a system I/O bottleneck as areas are loaded into memory as the view distance is very much increased by comparison - I find this test more demanding than the typical Hogsmeade test and can see shadows- and LOD pop-in on distant geometry.
 |
Cyberpunk, especially, seems to enjoy running on the RDNA3 architecture with around a 20 % performance increase over RDNA2 - something not shown before when testing the RX 7600.
Next, we come up against titles which are more strenuous for hardware to run, but not necessarily super performant, either.
Starfield sees another 20 % increase*, likely to do with some of the reasons outlined by Chips and Cheese regarding RDNA2's bottlenecks.
*This was performed before the current beta update...
Alan Wake 2 also shows a good 15 % increase between the two architectures.
 |
Finally, Metro Exodus sees an above 10 % improvement, with increasing performance as the difficulty of running the game gets harder at higher settings. This potentially indicates that with heavier workloads, the gap widens between the two architectures when given the same resources.
Superposition doesn't show as big of a gap here but that does make sense, given that we've already shown that it improves with memory frequency and my RDNA2 part is overclocked to narrow the gap...
It's been pointed out to me that I was misunderstanding the power references in HWinfo, so I'm just putting this conclusion on hold until I can be more certain about what the data is actually saying. I will update here when I do!
Rationalising the product stack...
When set at the same core frequency, there's a generational difference in performance that varies, depending on the workload. When averaged accross all the tests, we're looking at a real-world architectural uplift of ~15 % for Navi 32 vs 22 silicon from my own data.
*Minus Superposition, as I believe that the memory scaling is not typical in real world applications.
If I take a look at the TechPowerUp review data, I find that RDNA 2 performance scaling has a logical progression (taking into account clock speed and compute unit count): we see the expected reduction in ability to make the most out of increased compute resources. On the other hand, RDNA 3 oscillates up and down in performance as it scales in compute resources. At face value, this appears confusing but I think it actually has roots in what I posited last time, and alluded to at the beginning of this article.
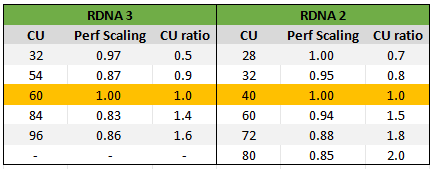 |
| Per compute unit scaling is all over the place for RDNA 3... |
As a result of moving the L3 "infinity" cache off-die onto the chiplets, there is a large hit to performance each time one of those chiplets is removed. So, the act of removing the bandwidth granted by otherwise having that chiplet results in below expected performance. There will also be lower data locality in the L3, further increasing latency to access data by having to jump out to the VRAM more frequently - and apparently, the data is implying that there isn't always a high enough hitrate on two of those products in the RDNA 3 stack relative to their compute demands. Hence why the RX 7700 XT and RX 7900 XT have worse performance scaling compared to their compute resources than the "full" chip RX 7800 XT and RX 7900 XTX.
With that in mind, we can apply the same logic to the already released parts to understand where, in terms of performance, they should be landing if they also experienced the same level of uplift as the RDNA 2 architecture:
 |
| The main take-away here is that RDNA3 is severely constrained by the L3 cache access at the higher end and by the lack of increased |
The RX 7900 XTX and RX 7800 XT both show a good performance uplift per CU versus their RDNA 2 "counterparts" (18% and 21% respectively). Meanwhile, the RX 7700 XT falls short - with an RDNA 2 equivalent slightly beating the 7700 XT by 3%. The RX 7900 XT does still beat its 'equivalent' part but only by 6%.
At the lower end of the stack, the RX 7600 is nowhere near meeting any sort of generational performance uplift (as we already know) and since this part has the dual-issue improvement, and L0, and L1 cache size increases*, this cannot only be due to data locality as well. This also implies that the generational performance uplift I'm observing in the RX 7800 XT is mostly due to the front-end clock increase and not the dual-issue FP32 compute units. But let's have another look at the architectural differences, using Nemez's microbenchmarking tool to look at specific instructions running on the two different architectures:
*Incidentally, I've found some glaring errors in the information provided on TechPowerUp's GPU database. It appears that they have erroneously indicated that the L0 and L1 caches were not increased on the N32 and N33 products. However, looking into Chips and Cheese's benchmarking, (and my own testing for N32) it seems clear from the results that the cache sizes are indeed matching N31's. It is only the L2 and L3 caches which are reduced in size for each Navi die and via the infinity cache/memory interface...
 |
For these tests, I'm once again keeping the core clocks locked at 2040 - 2060 MHz on the RX 6800 and keeping the core clock 'mostly locked' between 2000 - 2060 MHz on the RX 7800 XT - AMD's software just doesn't control it that well!
Straight away, the improvement to the FP32 pipeline is immediately obvious in almost all instruction types - though some have a greater improvement than others. What is interesting to me is the Int 16 improvement in RDNA 3 which I have not seen mentioned anywhere. An additional curiosity is the lack of gains in FP64 (not that it's really that useful for gaming?) given that I've seen it said that the dual-issue FP32 can run as an FP64 instruction as long as the driver is able to identify it. So, maybe this is purely the way this programme is written.
 |
Elsewhere, the RDNA 2 card matches the performance quite well and even beats the RDNA 3 card in some instruction throughput - but these are generally not useful for gaming workloads.
Moving over to looking at the available bandwidth, we again see how the RX 7800 XT outperforms the RX 6800 - storming ahead between 20 KiB and 2 MiB, and 12 to 64 MiB sizes. The RDNA 3 part clearly has a big advantage even at "iso"-core clocks. However, once you have the clock frequencies cranked up to stock (or higher) there's just no competition between the two cards - the RX 7800 XT matches or outperforms the RX 6800 in every metric except for Int 64, which really isn't relevant to gaming.
 |
| Comparison between RDNA 2 and 3 bandwidths per data size at the same core (shader) clocks... |
Speaking of operating frequencies, we see an interesting behaviour in the RDNA 3 part - at lower core (shader) clocks, the front-end is essentially equal. Whereas, as the shader frequency increases, the front-end frequency moves further ahead so that, by the time the shader clock is around 2050 MHz, the front-end is ~2300 MHz. Additionally, though I've not shown it below, at stock, the front-end reaches ~2800 MHz when the shader clock is ~2400 MHz.
This seems like a power-saving feature to my eyes - and it's not necessary to raise the front-end clock when the workload is light or non-existant!. There's no benefit!
 |
| The core clocks for the RX 6800 and the core vs front-end frequencies for the RX 7800 XT in Metro Exodus... |
What's interesting here, is that Chips and Cheese documented that the cards based on N31 also use this same trick whereas the N33-based RX 7600 actually clocked the front-end consistently lower than the shader clock, whilst also having lower latency than the N22 (RDNA 2) cards it was succeeding. Implying that there's some architectural improvement in how the caches are linked.
All of this information is then quite confusing when taken as a whole. For the higher-end parts, it seems that bandwidth is vitally important to the L3 cache in order to operate efficiently, along with L3 cache size. It also appears that the increased front-end clock frequencies help a lot. I think that increasing the size of the L0 and L1 caches should help with data locality which should help with instruction throughput and specifically with improving the use of the dual-issue FP32 capabilities of the re-worked compute units.
However, looking at the performance of N33, we see that the increase in L0 and L1 caches has had no apparent performance increase, that the card is data-starved due to the small L3 cache and that the lack of front-end core clock increase is also hamstringing the card compared to N23.
All of these design choices negate some amount of potential performance gains through the large latency and energy penalty for more frequently accessing not only the chiplets but further out to VRAM.
Conclusion...
In this very empirical overview, it is clear that, ignoring the increase in core (shader) frequencies, the RX 7800 XT has an architectural performance increase over the RX 6800. This also extends to the full N31 product (7900 XTX) as well. However, AMD's choice in reducing the L3 cache sizes for Navi 31 and Navi 32 appears to significantly hinder their overall performance. Additionally, the choice to move that L3 cache onto chiplets has resulted in a significant increase in energy use, and an over-dependence on the bandwidth to those chiplets. It also appears to be the case that there is an overhead for fully utilising the L3 cache, with performance dropping even before that limit is reached.
I didn't mention it in this blogpost, but the RX 7600 also doesn't have N31 and N32's increased vector register file size (192 KB vs 128 KB). However, since I don't have an understanding of how I could measure the effect of this on performance, I have decided to gloss over it - especially since Chips and Cheese do not appear to be overly concerned about it affecting N33's performance due to its lower CU count and on-die L3 cache.
What does appear to affect performance negatively is the choice to not clock the front-end higher on N33 and this is likely the source of a good amount of the observed performance bonus between the RDNA 2 and 3.
So, where does this leave us?
From my point of view, it appears that AMD made some smart choices for RDNA 3's architectural design which are then heavily negated by the inflexibility caused by going with the chiplet design and the need to bin/segregate in order to make a full product stack.
Moving to chiplets has also had the knock-on effect of increasing power draw (and likely heat), which has a negative impact on the ideal operating frequencies that each design can work at which has hindered the performance of the card. Just looking back at Metro Exodus, increasing the stock settings on the RX 7800 XT to +15 % power limit increases performance by 4 % (though this is only 3 fps!) showing that the card is still power limited as-released and may potentially see a bigger benefit to reducing operating voltage than RDNA 2 cards did.
Additionally, the RX 7600 appears hamstrung by the lack of increased front-end clock - perhaps due to power considerations? - and it is the choice to decouple front-end and shader clocks that seems to me to be the biggest contributor of RDNA 3's architectural uplift as it is this aspect which appears to allow the other architectural improvements to low-level caches and FP32 throughput to really shine.
10 comments:
Very interesting. So their first gen chiplets effort has pretty significant issues at the high end, which leads me to believing more the rumors that Navi 4x won't have a "90 class" part. Just not enough time to make the necessary architecture changes and still meet the planned RDNA4 launch window. N43 seems more "fixable" without radical changes though?
I honestly don't know.
I think they can make adjustments to the chiplets and improve things - obviously, more L2 and L3 would help, too. Adjusting bandwidth to chiplets when 'cutting down' SKUs to fill out the product stack? That's the largest challenge that I can see...
I checked my last submitted comment. Therefore, I will rewrite this comment.
Hello, I am a Korean enthusiast who is very interested in hardware. As soon as I saw AMD's Radeon RX 7800 XT, which was released three months ago, I realized that it was a segment where I could properly compare the gaming performance per clock of RDNA 2 and RDNA 3, but I was disappointed that no reviews. Then I found this article and was able to quench my thirst for curiosity. This comment was machine translated using Google Translate, so please understand.
◆ About the fact that the performance gap per clock through ‘RX 7600 vs 6650 XT’ was disappointing...
According to tests on the ComputerBase website, the gap in gaming performance per clock between the RX 7600 and 6650 XT is approximately 7.6%. The ComputerBase website compared the gaming performance per clock not only for the RX 7600 but also for the upper segment that uses a chiplet structure, with a gap of about 9.1% for the 7900 XT and a gap of about 4.5% for the 7900 GRE. I think it was just a disappointing rate of improvement compared to the 7900 XT, but it doesn't mean it wasn't there at all. I also wonder why the gaming performance improvement rate per clock of the 7900 GRE is lower than that of the 7600. Anyway, it was good that they compared multiple segments, but it was disappointing that both were compared based on more than one uncontrolled variable.
RX 7900 XT vs 6900 XT: GPU clock mismatch, WGP count mismatch, ROP count mismatch, GDDR6 SGRAM bus width mismatch.
RX 7900 GRE vs 6950 XT: ROP count mismatch.
Nevertheless, considering the fact that we rarely see reviewers who pay special attention to the comparison of gaming performance per clock of GPU microarchitecture, I think that part deserves praise.
To the next comment...
◆ Comparison of gaming performance per clock between Ampere and Ada microarchitecture through NVIDIA's GeForce 'RTX 4070 vs 3070'...
The comparison was also conducted on the Quasarzone website in a 1440p QHD resolution environment, and as a result of adjusting the GPU clock to 1.905 GHz and the GDDR6 SGRAM clock to 512 GB/s bandwidth, the gaming performance of the RTX 4070 was 4.6% lower than that of the 3070. came out.
After seeing these results, many people have misunderstood the question, 'Was the only factor in improving the performance of the GeForce 40 series being the high clock speed?' However, what most readers who do not know are overlooking is the case where only one fixed GPU clock was implemented. The ComputerBase website compared three types of RDNA 2, RDNA, and GCN microarchitectures through 'RX 6700 XT vs 5700 XT vs R9 390' and compared GPU clocks to two types (1 GHz, 2 GHz) instead of one. , because it emphasized that GPU large cache memory is useful for gaming. However, it was disappointing that the environments were different, with 1080p FHD in the 1 GHz test and 1440p QHD in the 2 GHz test.
◆ About reduction of Infinity (L3) cache memory capacity...
I understand that the L3$ capacity of the RX 6800 is 128 MB, not 96 MB. The number of ROPs is only 96, which is 1/4 less than the 128 of the 6800 XT.
◆ About the ‘chips and cheese’ website...
I'm glad you know about the chips and cheese website. Thanks to that website, I also found out that there was a discrepancy between the L1 cache memory capacity that was leaked before RX 7600 was released and the actual L1 cache memory capacity.
◆ About the ‘techpowerup’ website...
The techpowerup website is famous for its 'GPU-Z' utility, so it is a familiar place. However, among the specifications of the graphics cards listed in the GPU database, there are quite a few places where they are incorrectly written. Thinking that 'because it is managed by people, typos may occur', It can be tolerated, but the graphics card at the time of release, which is only rumored, is nonsense. There were frequent cases in each generation where some members of hardware community sites brought incorrect specifications for unreleased graphics cards, thinking that they were information about the specifications of graphics cards scheduled to be released.
For further discussion, please contact us via Gmail. This is because I am not familiar with Blogspot's comment feature.
Finish comment.
Hi Kkeubuni, my apologies for not approving these contents sooner. They did not appear in the interface for me to review. That's why the last comment was approved first.
I'll have a look over your observations and make a proper reply. I also need to take a look at the computerbase article. I don't think I'm familiar with it.
Hi Kkeubuni,
I've finally recharged enough to address your comments! Let me first say thanks for reading my blogpost fully and having very thoughtful and careful comments - machine translated or not! :)
◆ RE: The ComputerBase article:
I am also reading the article via translation so maybe something is lost that I am not understanding but here are my criticisms:
- ComputerBase contradict themselves within the article - in page 2 they state, "RDNA 3 is simply not faster with the same number of execution units without clock jump"
Then on page 4 they state, "The Radeon RX 6650 XT clocks in a full HD test course with an average of 2,634 MHz, the Radeon RX 7600 at 2,645 MHz. The difference is therefore 0.42 in favour of the RDNA 3 card. In the performance rating of the gridizer games, the Radeon RX 7600 is again eight percent faster than the Radeon RX 6650 XT."
Both cannot be true!
We know that performance range of silicon does not have a linear relationship between clockspeed, power, voltage, and memory data transfer. Therefore, we need to take into account where on that relationship landscape we test the parts in a comparison.
From my perspective, the 6650 XT is an overclocked 6600 XT - with the primary difference being memory clock and TDP. Looking at the steady-state core clock frequencies of reviewed cards over on TechPowerUp, the 6600 XT was already around 2650 MHz using the partner cards. In comparison, the singular tested 6650 XT reached 2702 MHz - a 25 - 50 MHz increase.
https://www.techpowerup.com/review/msi-radeon-rx-6650-xt-gaming-x/34.html
We would not expect any performance increase in this scenario but we did, in fact, see a 16-20% performance increase between the 6600 XT and 6650XT - a fact acknowledged by ComputerBase (page 2).
From what I can see, this performance increase was solely due to the increase in memory frequency and the increase in board power (160 W vs 176 W). We also observe this in my testing above with the 7800XT where I increased the power by 15% and saw an associated 6% uplift in Metro Exodus.
The conclusion of this information (for me) is that the 6600 XT/6650 XT core is working at the peak of its frequency curve and will not be efficient as it is pushed further. The other conclusion is that the card is likely power-limited in both configurations.
This means that it should, in my opinion, be tested below this core clock frequency to ensure that power draw is not the limiting factor as we are aware that even if the core frequency is reporting the same value, power limitations will reduce performance.
Just look at the summary difference between TechPowerUP's overclocking sections for the RX 6800 and RX 6600 XT.
https://www.techpowerup.com/review/amd-radeon-rx-6800/40.html
https://www.techpowerup.com/review/asrock-radeon-rx-6600-xt-phantom-gaming-d/36.html
In fact, if you compare different outlets' testing, you see a different conclusion than ComputerBase's about the relative performance difference:
TechpowerUp: 3 % performance lead for RX 7600
TechSpot/Hardware Unboxed: 3.5 % lead for RX 7600
Tom's Hardware: 4.0 %
Ars Technica: 8 %
ComputerBase 8 %
I believe that this difference will be affected by which specific cards are being compared as some RX 6650 XTs are "better" than others in the same way some RX 6600 XTs are better...
Moving on to my testing, we can apply the same logic: Are the RX 6800 or RX 7800 XT in some sort of limited scenario?
I know from my previous work that the RX 6800 is not power limited at stock settings and that there is at least a 20-40 W and 231 MHz core frequency / 100 MHz memory frequency headroom to be had without having to push the power slider higher.
https://hole-in-my-head.blogspot.com/2023/02/the-power-curve-of-rx-6800-and.html
This is why I reduced the core frequency to around 2050 MHz, when stock settings has it at 2219 MHz, to remove any interference from limitations. As I noted in this article, I re-confirmed that the performance cannot increase beyond a +100 MHz memory frequency increase.
I then also performed the same considerations with the RX 7800 XT, ensuring that it was not power limited by having the core clock appreciably reduced (to the same around 2050 MHz) as we could see that the card is power limited at stock settings (a 6% increase in fps just from raising power limit is not a good sign that the silicon is being utilised fully, it will be pulling back in some manner despite whatever the core frequency report).
---------------------------
So, given these data, I do not believe that the RX 7600 has an 8 - 9 % performance gap, clock for clock, over the RX 6650 XT. I think that testing, similar to what I have performed here, for the reasons outlined above, needs to be done to definitely show there is a substantial uplift...
◆ About reduction of Infinity (L3) cache memory capacity...
This was a typo. You are correct: the L3 was reduced from 128 MB on the RX 6800.
◆ Comparison of gaming performance per clock between Ampere and Ada microarchitecture through NVIDIA's GeForce 'RTX 4070 vs 3070'...
Unfortunately, I cannot read or navigate this website and machine translation does not appear to be available on my browser.
Oh, and Kkeubuni,
You don't have your gmail in your blogger profile. I couldn't email you these, unfortunately.
Is it your username @gmail.com?
Post a Comment